Hey Learner! Let’s dive into another episode of learning how to debug LWC components. Debugging is an essential part of the development process. It allows you to identify and fix issues in your code, and ensure that your Lightning Web Components (LWC) work as intended. In this blog, I'll walk you through debugging standard Lightning Web Components using the debug mode of Salesforce and also Inspect Element Using Chrome Developer Tools.
Table of Contents:
Understanding the Basics of Debugging
Debugging Techniques for Lightning Web Components
○ Debug mode
○ Console Logging
1. Understanding the Basics of Debugging
Before diving into the specifics of debugging LWCs, it's crucial to understand the fundamentals of debugging. Debugging is the process of identifying and fixing errors or unexpected behavior in your code. It involves examining the code, isolating the problem, and making necessary corrections.
Debugging is not just about finding and fixing errors; it's a problem-solving process. It involves identifying why your code is not working as expected and finding a solution to rectify it.
Debugging requires logical thinking and analytical skills. You need to analyze the code's logic, data flow, and dependencies to pinpoint the root cause of issues.
Debugging often requires isolating specific parts of your code to narrow down the problem's location. This may involve commenting out code, using print statements, or setting breakpoints.
2. Debugging Techniques for Lightning Web Components
Console Logging
Debug Mode
Console Logging
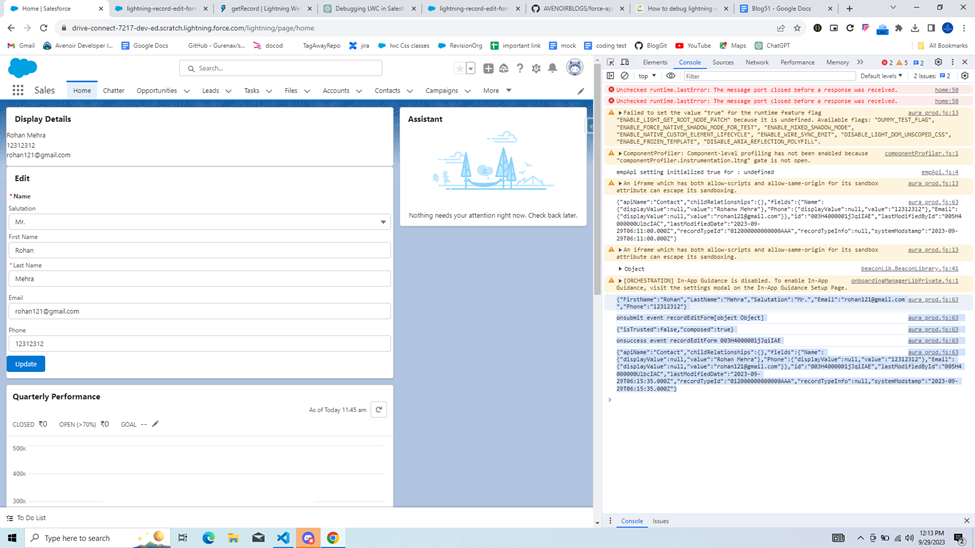
Console logging is a simple yet effective way to debug Lightning Web Components. You can use console.log() statements to output messages to the browser's console.
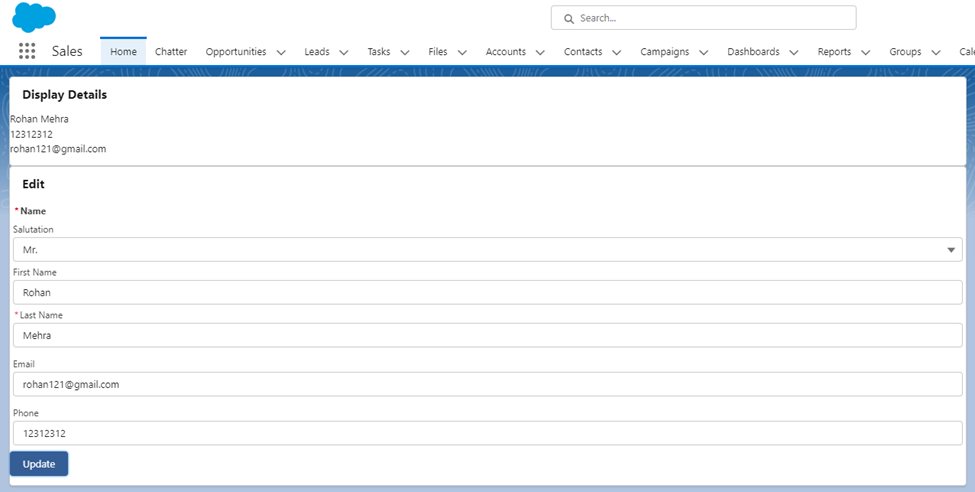
Standard Lightning Web Components provided by Salesforce, such as lightningRecordEditForm, operate with a level of automation that limits your ability to finely control data loading and updates. In this context, we've implemented custom events within this component to facilitate debugging and gain insights into its behavior by utilizing console logging.
For Example:-
Wire Method (@wire getRecord):
We are using the @wire decorator to fetch data based on the recordId.
We can use console.log() to log the data or error when the wire method retrieves the record.
If the wire method doesn't retrieve the data as expected, you might not get the correct record information in the component. You should ensure that the recordId is correctly set, and there are no issues with field references (e.g., "Contact.Name").
HandleSubmit :
In the handleSubmit method, you are preventing the default form submission, logging the fields using console.log() to get fields as expected or not.
then submitting the form using lightning-record-edit-form.
debugLightningCmp.html
<template>
<lightning-card title="Display Details">
    <template if:true={contactData}>
        <ul>
            <li>{contactData.fields.Name.value}</li>
            <li>{contactData.fields.Phone.value}</li>
            <li>{contactData.fields.Email.value}</li>
        </ul>
    </template>
</lightning-card>
    <lightning-card title="Edit">
        <lightning-record-edit-form record-id={recordId} object-api-name="Contact" onsuccess={handleSuccess} onerror={handleError} onsubmit={handleSubmit}>
         <lightning-input-field field-name="Name"></lightning-input-field>
            <lightning-input-field field-name="Email"></lightning-input-field>
            <lightning-input-field field-name="Phone"></lightning-input-field>
            <lightning-button variant="brand" type="submit" name="update" label="Update">
            </lightning-button>
        </lightning-record-edit-form>
    </lightning-card>
</template>
debugLightningComp.js
import { LightningElement,wire,api } from 'lwc';
import { getRecord } from "lightning/uiRecordApi"


const FIELDS = ["Contact.Name", "Contact.Phone","contact.Email"];


export default class DebugLightningCmp extends LightningElement {


    @api recordId;
    contactData;
    error;


    @wire(getRecord, { recordId: "$recordId", fields: FIELDS })
    wiredRecord({ error, data }) {
        if(data) {
            console.log(JSON.stringify(data));
            this.contactData = data;
        }else if(error) {
            console.log(JSON.stringify(error));
            this.error = error;
        }
    }


    //Edit form
    handleSubmit(event) {
        event.preventDefault();
        const fields = event.detail.fields;
        console.log(JSON.stringify(fields));
        this.template.querySelector('lightning-record-edit-form').submit(fields);
        console.log('onsubmit event recordEditForm'+ event.detail.fields);
    }


    handleSuccess(event) {
        console.log(JSON.stringify(event));
        console.log('onsuccess event recordEditForm', event.detail.id);
    }


    handleError(event) {
        console.log(JSON.stringify(event));
        console.log('SomeError Occur');
    }

}
Steps to debug LWC component by Console Logging
Step 1: Navigate to the screen with the newly created lightning web component.

Step 2: Right Click on the Mouse or f12 on the keyboard for Inspect Mode


Step 3: On the right you get a tab console click on the tab to get the console log

Step 4: On clicking on the console tab you get all the console log statement there which has been triggered by the lwc component code.

Debug Mode
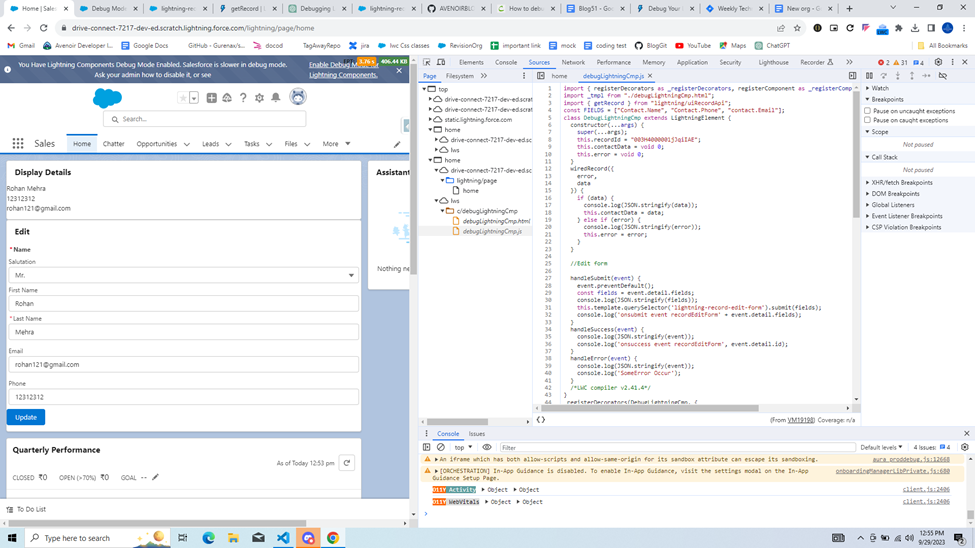
Debug mode downloads detailed or un-minified versions of the Javascript files in the browser, enabling developers to debug the code line by line. In addition to this, we can also see the page load times for each page (top right corner of the Salesforce screen) which is useful when working on the performance issues. Salesforce is slower for users who have enabled debug mode. Hence, enable it only when required.
Let setup Debug Mode for debugging the LWC component
Step 1: Enable Debug Mode
Go to the setup of your org —> type debug mode in Quick Find and select debug mode. It will open the Debug mode page Now select the user from the list and click on the Enable button at the top of the list.


Step 2: Now we need to go to the Chrome tab where our lwc component is loaded (refresh tab).

Step 3: Right-click and select inspect mode. A developer tool will be launched.


Step 4: You will see the source tab on top click on that

Step 5: Navigate to lightning > find your component (2), click the component file or click ctrl + P and search the component file by filename

Step 6: Add breakpoints to the lines from which you want to see the output in the run time. Now you can add breakpoints to the component to execute code line by line and also see output at runtime and debug.

Step 7: Refresh the screen. Breakpoints will activate, and the context is paused at the line with the first breakpoint added in the previous step.

Step 8: Click on the stepover button or f10 to run or execute the breakpoint line code. In this way, you can Debug Lightning web component code and make each line of code execute as expected.
Conclusion
Debugging is an indispensable skill for any developer, and it plays a crucial role in ensuring the functionality and reliability of Lightning Web Components (LWC) in Salesforce. In this blog, we've explored two primary techniques for debugging standard LWCs: Console Logging and Debug Mode.
Console Logging provides a straightforward method for displaying messages and data in the browser's console. By strategically placing console.log() statements in your code, you can gain insights into the execution flow, variable values, and potential errors. This technique is especially useful for quick and simple debugging tasks.
On the other hand, Debug Mode offers a more comprehensive debugging experience. It allows you to inspect and debug your LWC code line by line, set breakpoints, and analyze variables and their values during runtime. Debug Mode is a powerful tool for tackling complex issues and understanding how your code behaves in real-time.
Remember that enabling Debug Mode should be done sparingly, as it can impact the performance of Salesforce for users. It's best reserved for situations where in-depth debugging is necessary.
In conclusion, mastering these debugging techniques will empower you to efficiently identify and resolve issues in your Lightning Web Components, ultimately leading to more robust and reliable Salesforce applications.
If you'd like to see the code and resources used in this project, you can access the repository on GitHub.To access the AVENOIRBLOGS repository, click here. Feel free to explore the code and use it as a reference for your own projects.
Happy Coding! You can leave a comment to help me understand how the blog helped you. If you need further assistance, please contact us. You can click "Reach Us" on the website and share the issue with me.
References
● https://help.salesforce.com/s/articleView?id=sf.aura_debug_mode.htm&type=5 ● https://help.salesforce.com/s/articleView?id=sf.aura_overview.htm&type=5 ● https://help.salesforce.com/s/articleView?id=sf.aura_features.htm&type=5 ● https://developer.salesforce.com/docs/atlas.en-us.lightning.meta/lightning/aura_debug_mode.htm
Blog Credit:
S. Kumar
Salesforce Developer
Avenoir Technologies Pvt. Ltd.
Reach us: team@avenoir.ai
Are you in need of Salesforce Developers?


Comments